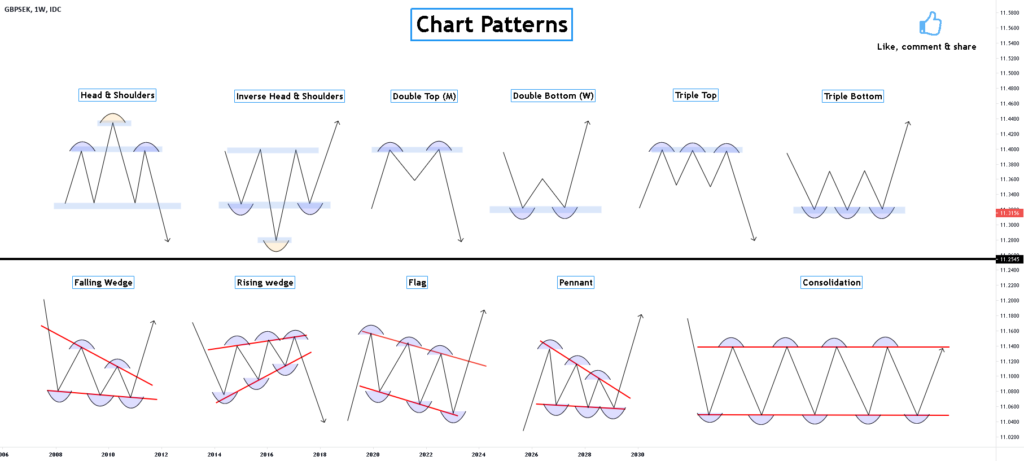
Understanding crypto chart patterns is perhaps the strongest thing that any beginner trader can acquire. Such patterns, created by the price movement of cryptocurrencies, are optical stimuli that will inform you of the probable trend of the market. Whether you’re investing in Bitcoin, Ethereum, or smaller altcoins, you can make better choices rather than relying on guesswork if you can identify these patterns.
In this guide, we’ll explore the most reliable crypto chart patterns for beginners, explain how they work, and highlight why mastering them can improve your trading strategy.
Why Crypto Chart Patterns Matter
Cryptocurrency markets are notoriously volatile. Prices can soar or melt away in a matter of minutes, and it’s difficult to have any idea what will happen next. Patterns in crypto charts give traders a tool for interpreting market sentiment because they show the actions of buyers and sellers at critical price levels.
From interpreting these patterns, newbies gain the following advantages:
- A structured approach to predicting market action
- Confidence to go in and out of trades
- A foundation for creating advanced trading methods
- Rather than reacting emotionally, disciplined and regular action can be taken by traders who understand crypto chart patterns.
Types of Crypto Chart Patterns
There are three general types of chart patterns: continuation, reversal, and bilateral patterns. Each provides something unique about the market’s behavior. Let’s look at the most dependable ones for a beginner.
- The Head and Shoulders Pattern
- Head and shoulders is an extremely popular reversal pattern. It signals that a ongoing trend is ending.
- Pattern: Three peaks are created – a high middle peak (the head) and two small peaks on either side (the shoulders).
- Meaning: In an uptrend, it signals faltering buying pressure and thus the reversal to a downtrend is near.
- Why it’s useful: New traders can easily recognize this pattern and use it to avoid purchasing at the top of a rally.
- Double Top and Double Bottom
- They’re classic reversal crypto chart patterns that indicate a change in direction.
- Double Top: Occurs after an uptrend when price forms two tops at the same level. It indicates resistance and potential downward reversal.
- Double Bottom: When price forms two lows at the same level of support, follows a downtrend. This shows that the market is ready to bounce up.
- Key tip: Novices wait for confirmation, such as the breakout below support (for double tops) or above resistance (for double bottoms), before entering a trade.
- Triangles (Ascending, Descending, and Symmetrical)
- Triangles are continuation patterns that show that the current trend is likely to resume once the price breaks out.
- Ascending Triangle: Built by a horizontal resistance line and rising support. It is likely to indicate bullish continuation.
- Descending Triangle: Built by a horizontal support line and declining resistance. This normally indicates bearish continuation.
- Symmetrical Triangle: Built when the support and resistance intersect each other. The breakout is likely to go either direction and is therefore a bilateral pattern.
- Why it matters: Triangles are simple and ubiquitous to find in crypto markets and offer newcomers a number of trading opportunities.
- Flags and Pennants
Flags and pennants are short-term continuation crypto chart patterns that reverse abruptly from sharp price movements.
- Flag: Brief rectangular shape that slopes contrary to the prevailing trend.
- Pennant: Similar to a symmetrical triangle but brief and of shorter duration.
- Usage: They show a small consolidation before the trend resumes. They provide good entries for beginners in trending markets.
- Cup and Handle
A bullish continuation pattern that resembles a tea cup.
- Cup: Price continuously drops and then rises, forming a rounded bottom.
- Handle: Price pullback in a limited amount after the cup, before the breakout.
- Meaning: It signifies accumulation and anticipation of continued upward movement.
- Why it’s helpful: Easy to identify and also often seen in cryptocurrencies in longer-term bull cycles.
How Crypto Chart Patterns can be employed by Beginners
- Pattern identification is just half the job. To maximize gain, beginners should follow these steps:
- Use with Volume: Always confirm with trading volume for a pattern. As an example, high-volume breakout-supported patterns are more reliable.
- Use Support and Resistance: Mark key levels to understand where patterns are forming.
- Avoid Overtrading: Not all patterns will prove to be a profitable trade. Be disciplined and patient.
- Practice on Demo Accounts: Practice identifying and trading patterns on demo accounts prior to risking real capital.
- Pair with Risk Management: Even good patterns can fail. Always employ stop-loss orders to hedge your capital.
Common Mistakes to Avoid
- Overlooking Timeframes: A trend on a small time period may be less important than one on a daily chart.
- Forcing Patterns: Beginners often see patterns where there are none. Search for clean and sharp structures.
- Chasing Breakouts at the Wrong Time: Trades that include going in after a breakout has already moved a significant distance are riskier.
- By avoiding these mistakes, starters can substantially increase their success rate while trading with chart patterns.
Conclusion
Crypto chart patterns are a trader’s best friend in terms of imposing order on the occasionally chaotic world of cryptocurrency. No pattern can ever guarantee success, but they bring discipline, improve decision-making, and reduce the need to employ emotion.
For new traders, mastery of sound patterns such as head and shoulders, double bottoms and tops, triangles, flags, and cup and handle can be a good starting point for profitable trading. Combined with patience and proper risk management, these patterns can direct traders to more dependable results in the choppy crypto market.
Taking the time to learn and apply these crypto chart patterns places beginners on their path towards being more competent and confident traders.

